US Market Social Reporting Pipeline
Automated ETL pipeline for multi-channel social media reporting via zero-cost Python processing
Client Archetype
Global entertainment brand managing a high-velocity social content operation across TikTok, Instagram, and Facebook. The brand publishes dozens of posts per month across all three channels and requires consistent, accurate monthly performance reporting to inform content strategy and demonstrate value to internal stakeholders.
Core Challenge
Across the agency landscape, tightening client budgets and hourly-based fee structures are applying increasing pressure on analytics and reporting scopes. Reporting is often the first line item to get compressed, yet it remains one of the most labor-intensive deliverables an agency produces each month. The challenge is compounded by the nature of social data itself. Multi-channel reporting is deceptively complex, not because the datasets are large or the math is advanced, but because the data is fragmented. Different platforms export data in different formats, with different schema conventions, different null representations, and different URL structures for the same post. Reconciling all of that into a single clean dataset requires significant analyst time every single month.
Methodology
Prompt Library (v1)
DYC developed a structured prompt library in Notion to systematize the ETL process across three phases: Clean, Aggregate, and Analyze. Each prompt encoded a specific transformation rule, filtering by network, removing promoted posts, standardizing decimal formats, and computing engagement metrics. This reduced the monthly reporting cycle from 2 to 3 days to under a day, and served as the foundation for a more scalable architecture.
AI-Assisted Pipeline Design (v2)
The prompt library was used as a specification document. Each prompt was audited to determine whether it required genuine AI judgment or was simply a deterministic transformation. Filtering rows, replacing null placeholders, computing IQR-filtered medians, joining files on normalized post text: none of these require intelligence. They require code. This audit became the blueprint for v3.
Proprietary ETL Pipeline (v3)
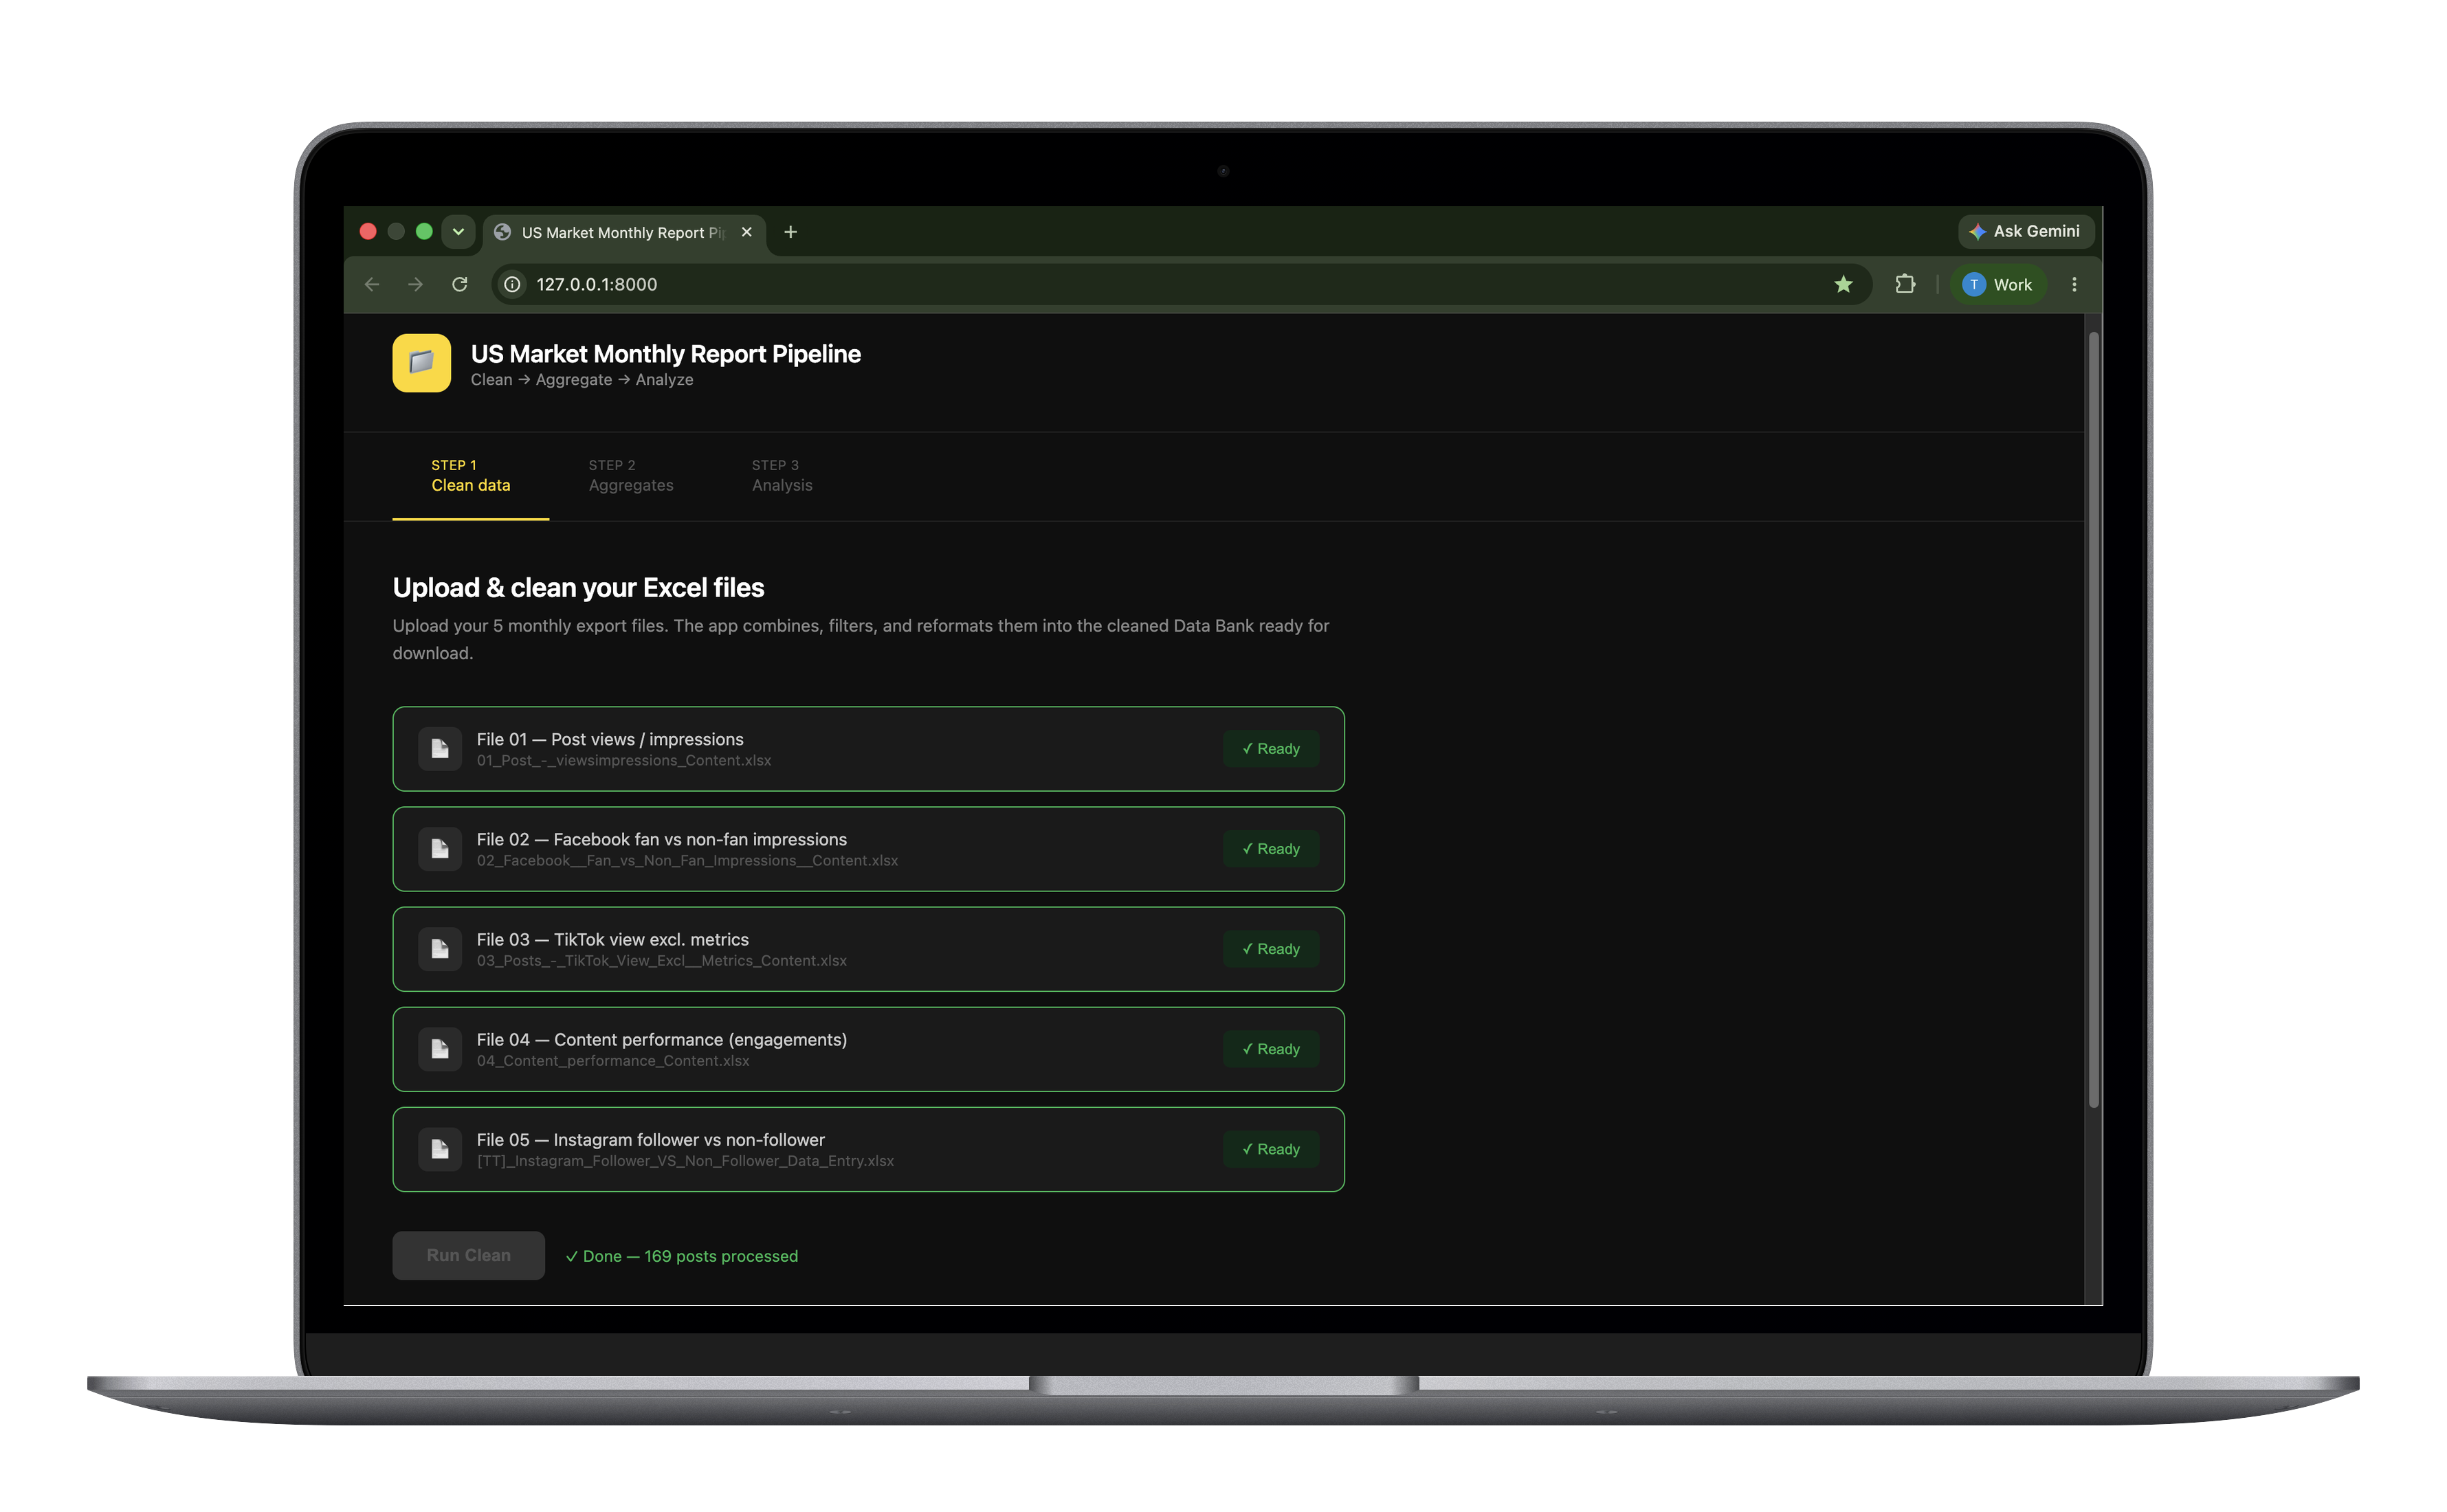
DYC rebuilt the entire workflow as a locally-hosted web application: a FastAPI Python backend with a browser-based frontend. The pipeline ingests five source files across three channels, executes all cleaning, joining, and aggregation logic in Python/pandas, and produces three downloadable outputs in under 10 minutes. Zero LLM API calls are made during the monthly workflow. AI was used to design and maintain the infrastructure. Python handles the data.
Pipeline Architecture
| Phase | Input | Logic | Output |
|---|---|---|---|
| Clean | 5 source files (Brandwatch + manual) | Filter, deduplicate, join, normalize | Master Data Bank |
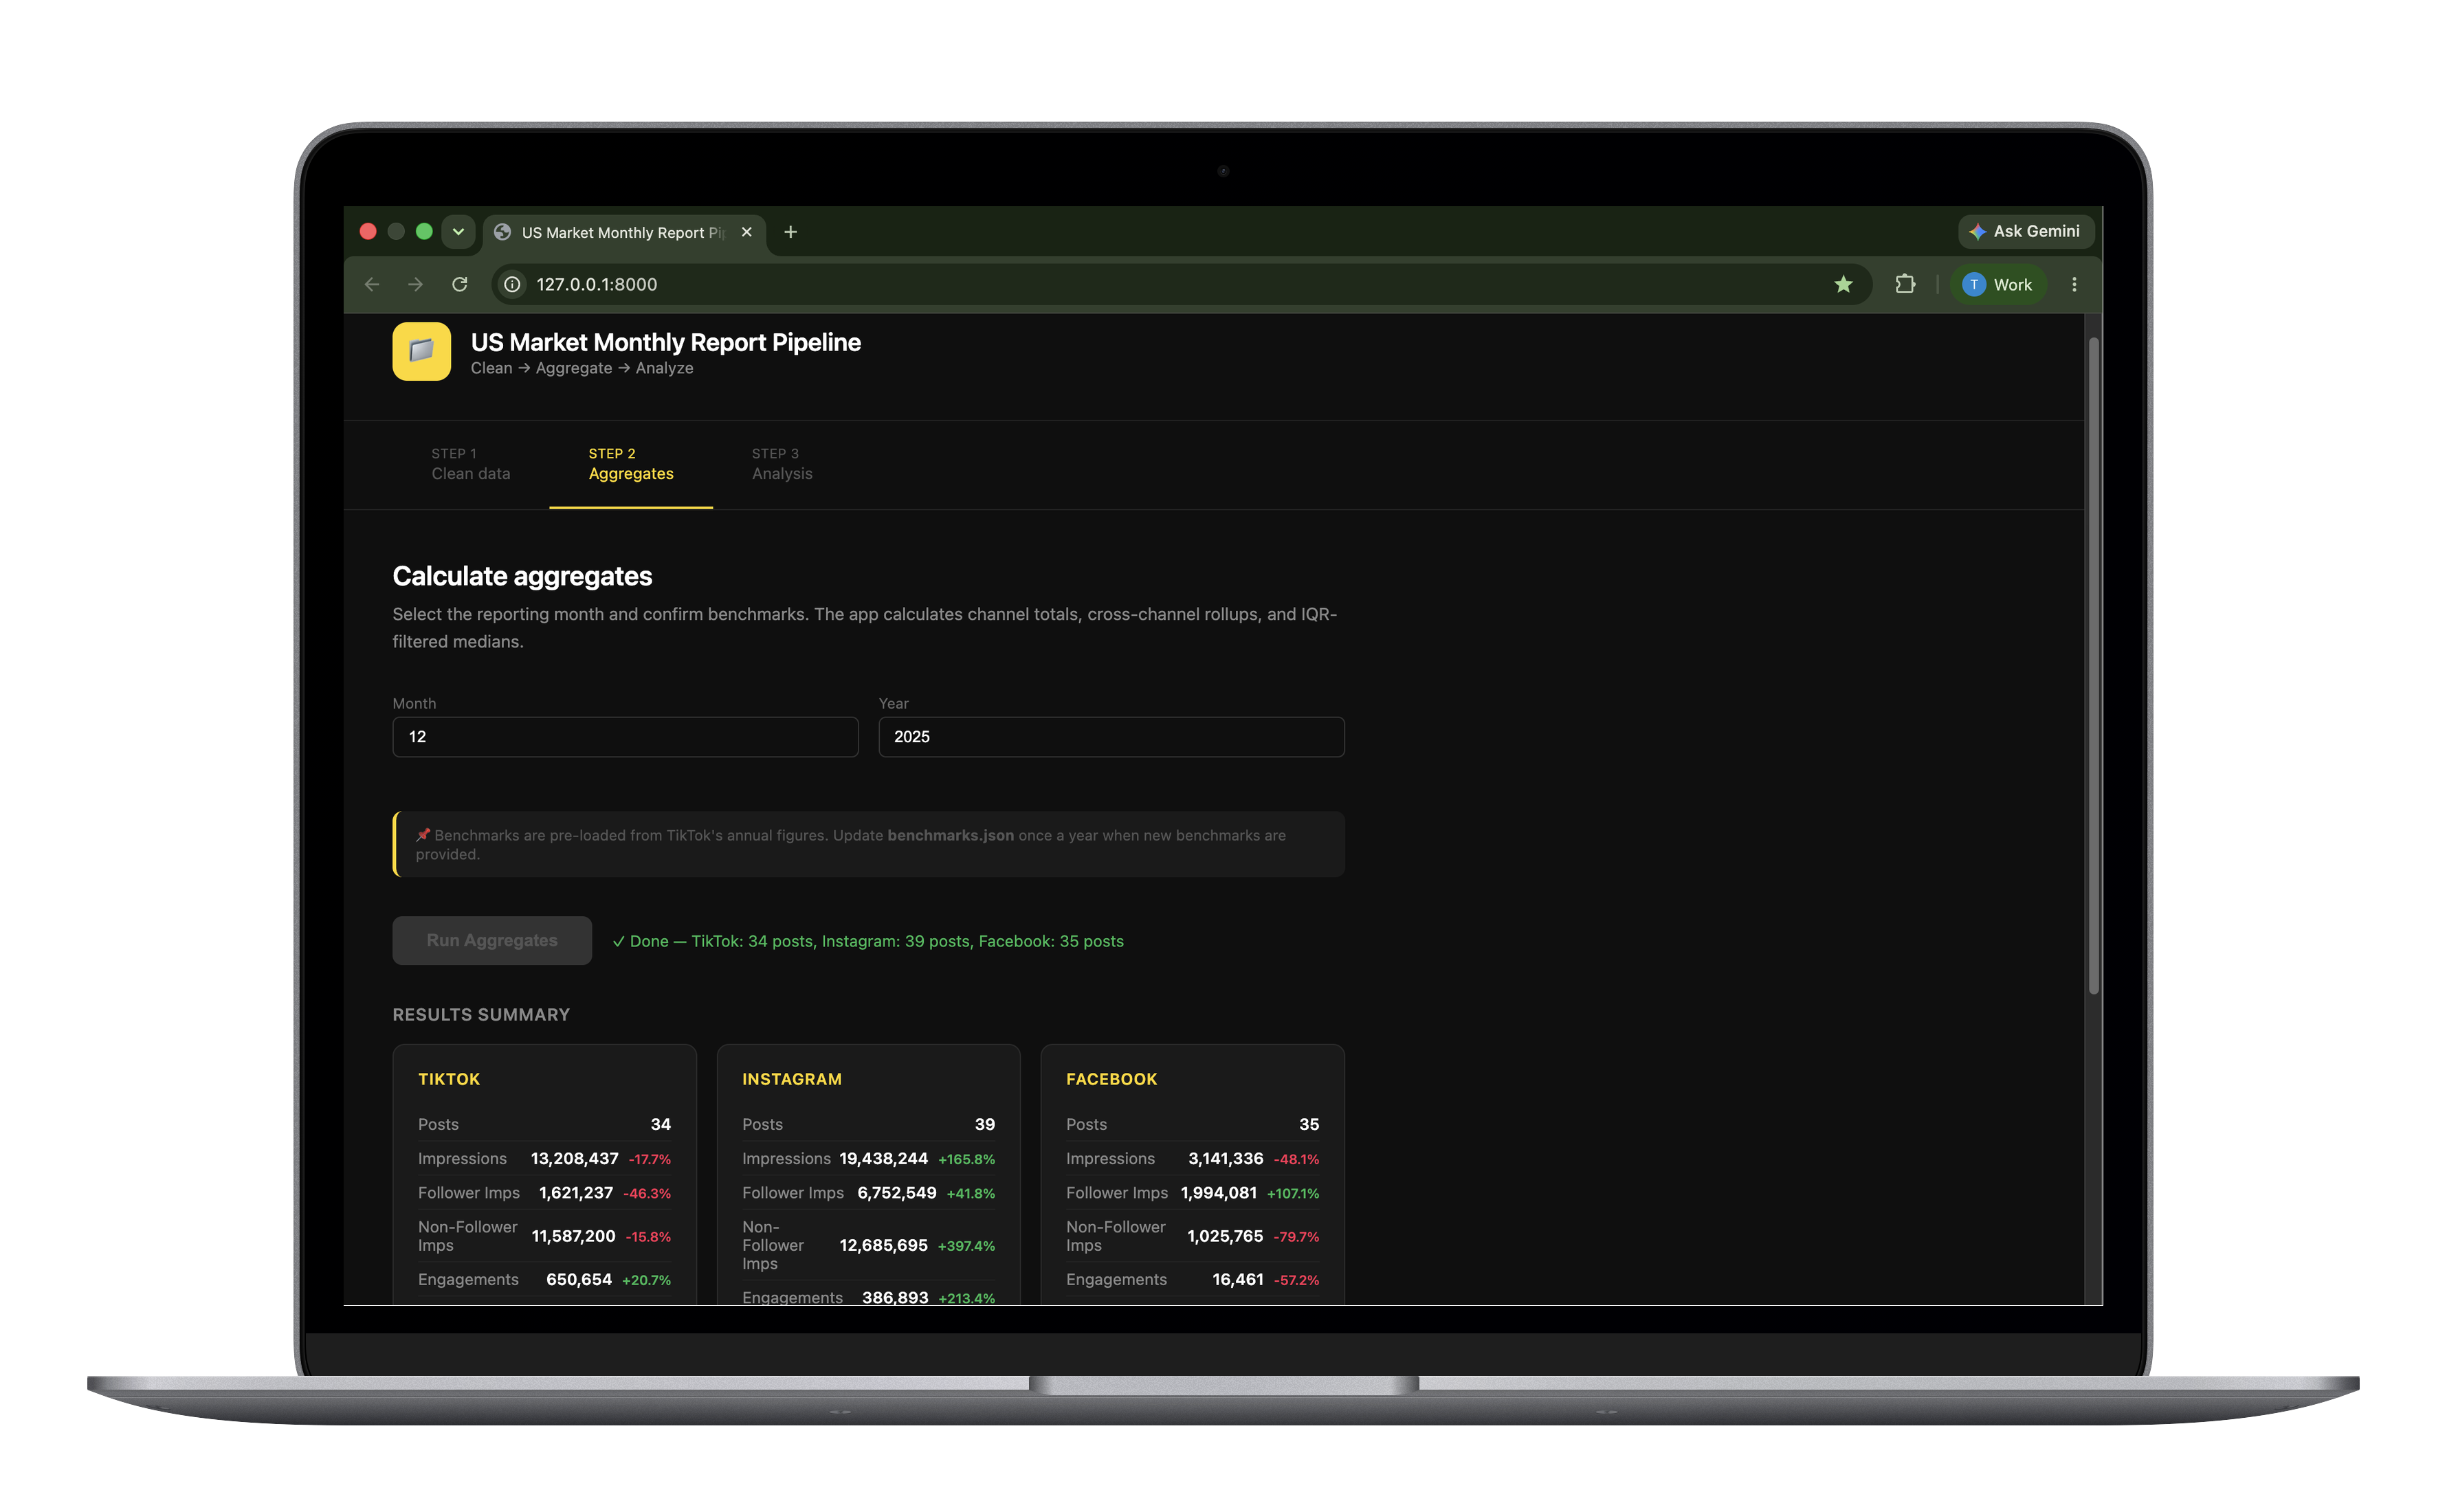
| Aggregate | Master Data Bank | Channel totals, IQR medians, benchmark comparison | Aggregates report |
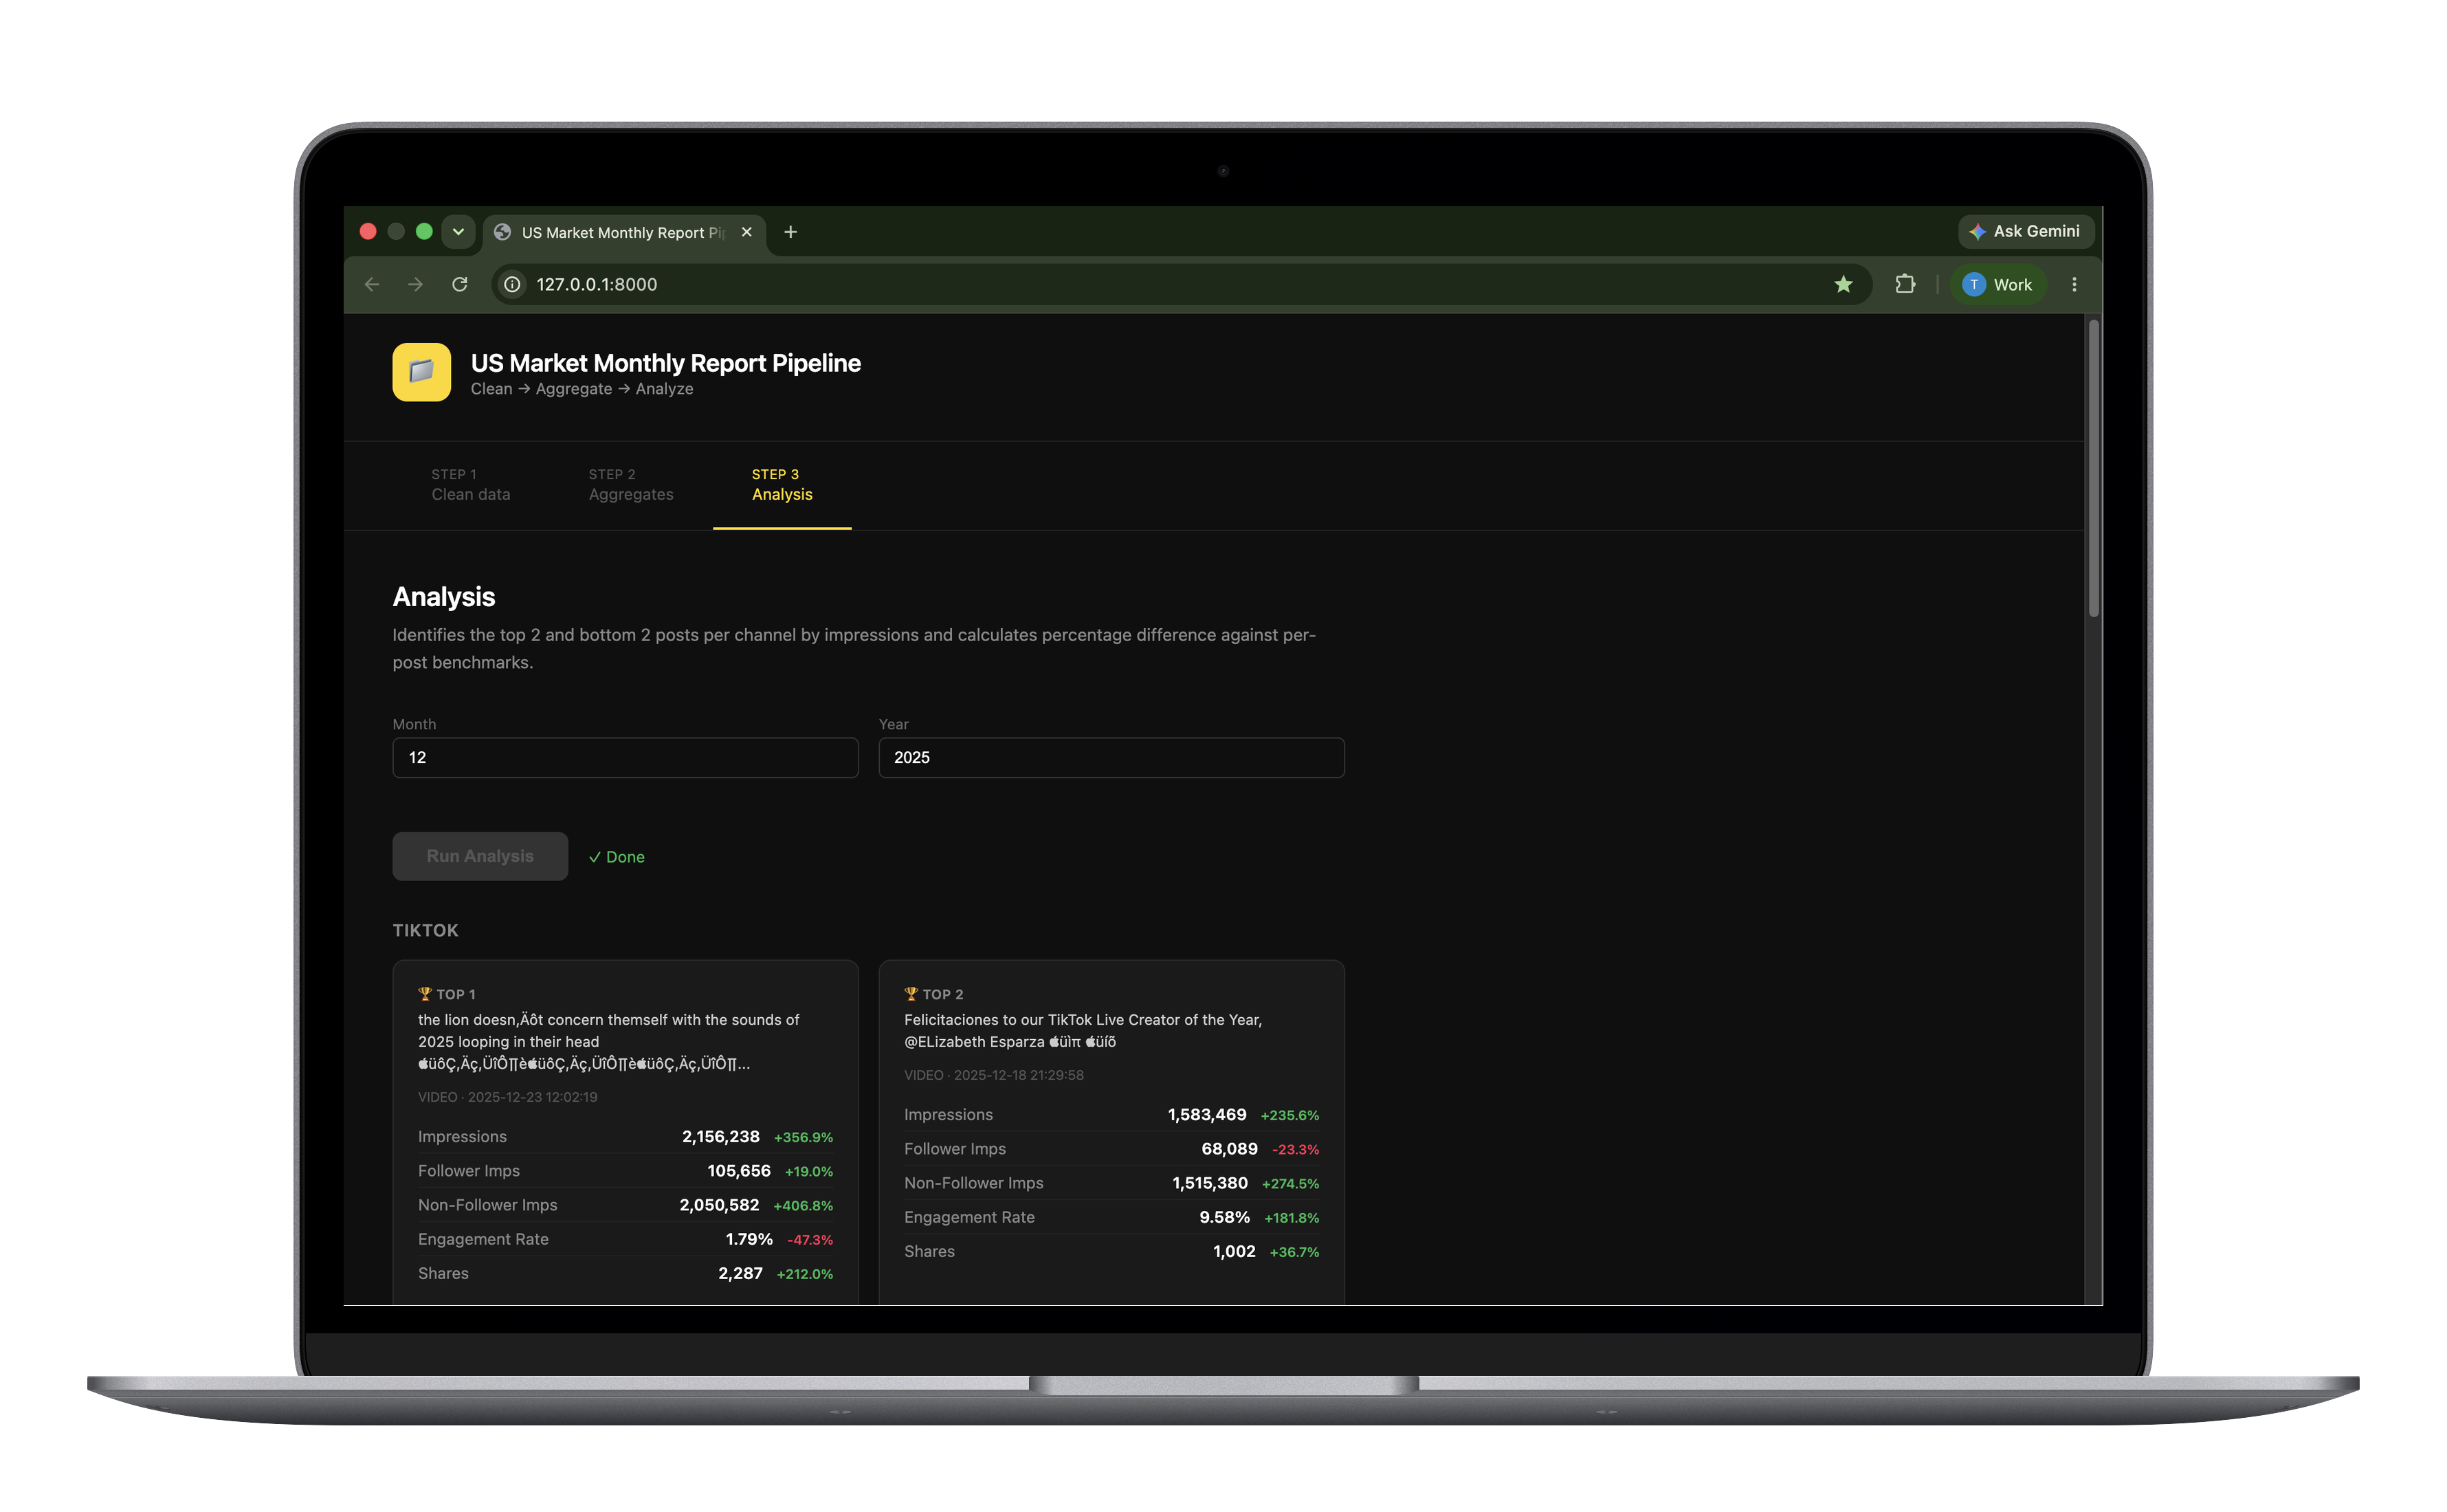
| Analyze | Master Data Bank | Top/bottom performers vs. per-post benchmarks | Analysis report |
Results
2 to 3 days reduced to under 10 minutes for the full monthly ETL cycle.
Zero marginal token cost per monthly report run.
Full IP ownership. No dependency on third-party platforms, hosted services, or external accounts.
Key Insight
AI manages the infrastructure build and maintenance. Python manages the data.
AI adoption needs to be intentional. The most important decision in this project was not which AI tools to use, but where not to use them. The v1 prompt library was a necessary step. It surfaced and systematized the institutional knowledge required to build something more durable. But using AI to run deterministic transformations every month is the wrong application of the technology. It introduces recurring costs, latency, and a dependency on external APIs for work that Python can do faster, cheaper, and more reliably.
Explore the Pipeline
A look at the three-step interface, from raw file upload to final analysis.